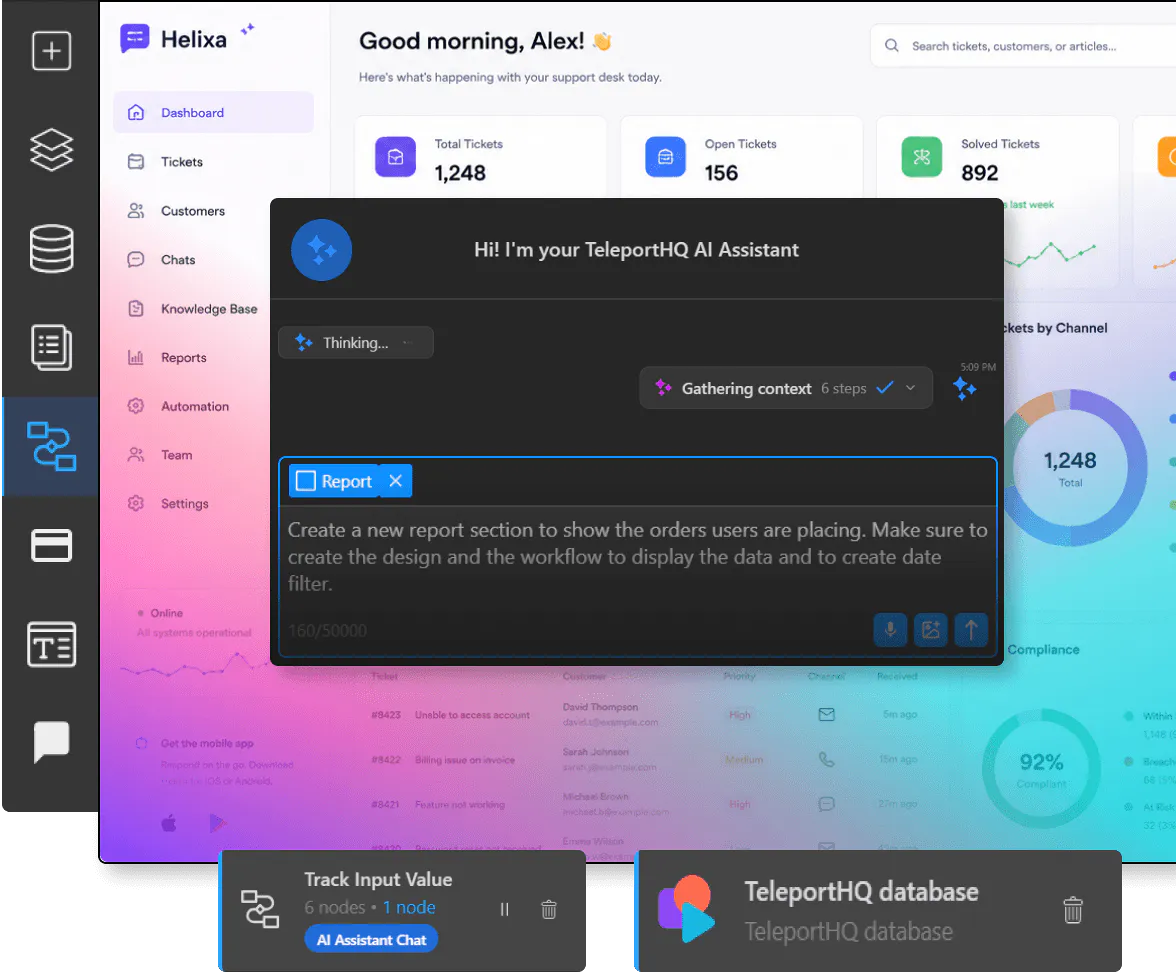
Dashboards & reporting
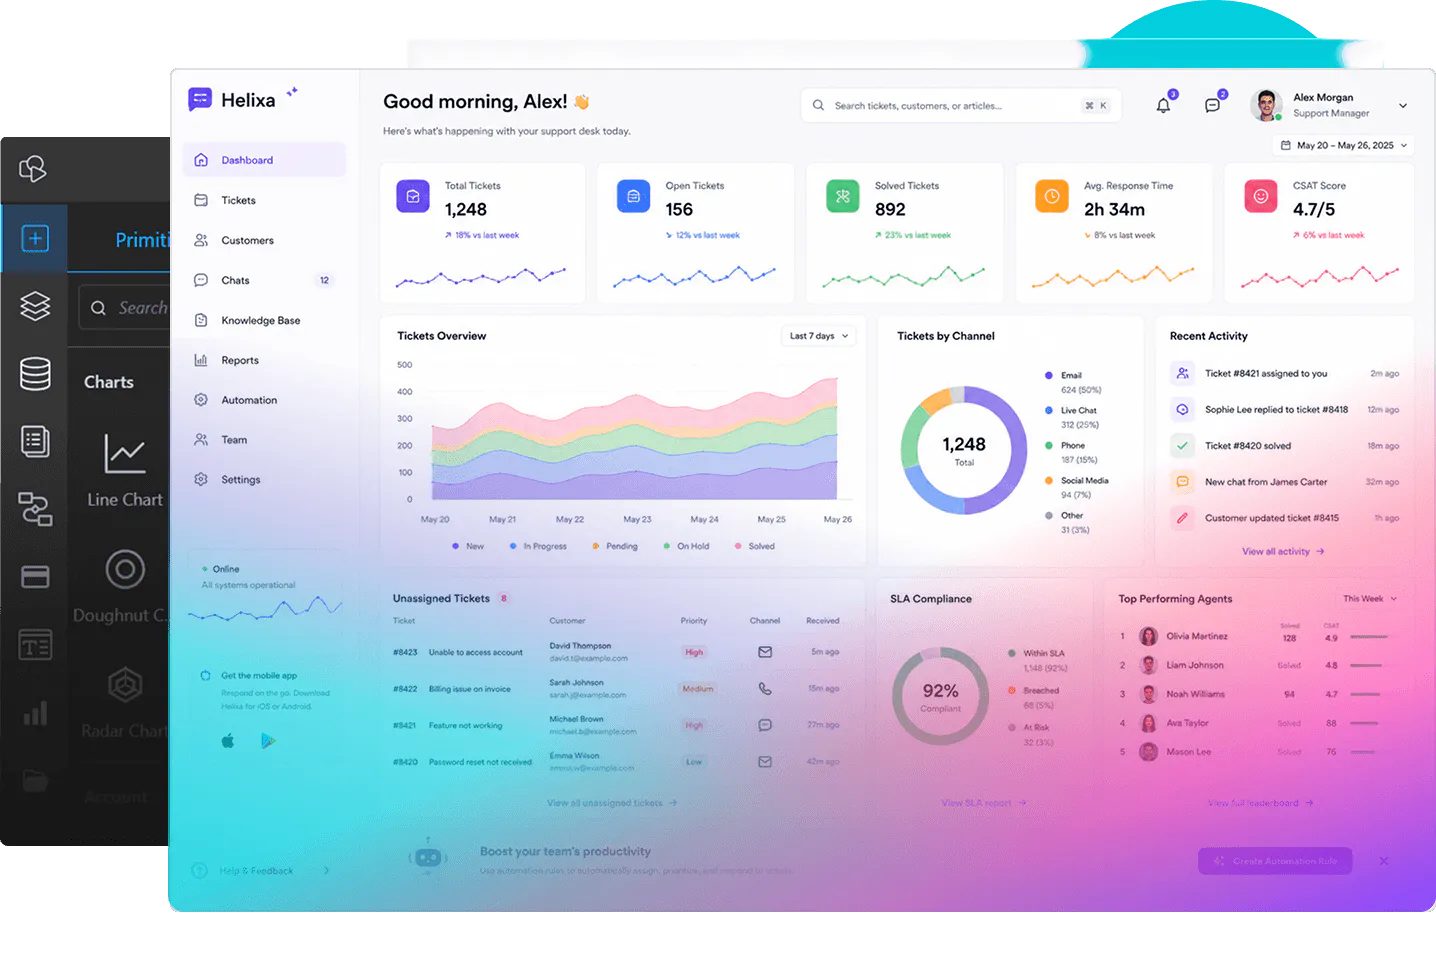

How your dashboard is built
Create and manage your reporting system step by step
TeleportHQ allows you to build dashboards that connect data, workflows, and visual components. You define how information is processed and how it is displayed.1. Set up your dataCreate databases for metrics, events, logs, and business data using structured data models.
2. Define workflowsAutomate data updates, calculations, aggregation, and reporting processes across your system.
3. Design the interfaceBuild dashboards, charts, and reporting views using the visual editor with AI support.
4. Manage and scaleUse the admin panel to manage data, monitor activity, and expand reporting capabilities.
Built for data insights
Key dashboard capabilities you can build and control
TeleportHQ allows you to create dashboard systems that track data, visualize metrics, and generate reports. You control how data is processed and how insights are presented.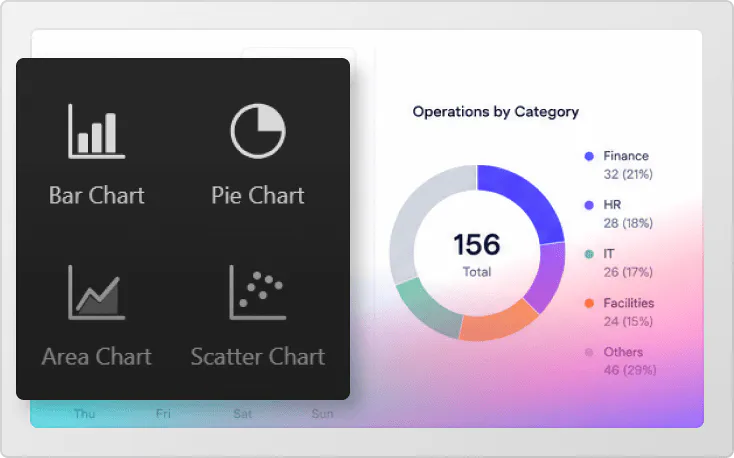
Data visualization
Display metrics using charts, tables, and visual components connected to real data.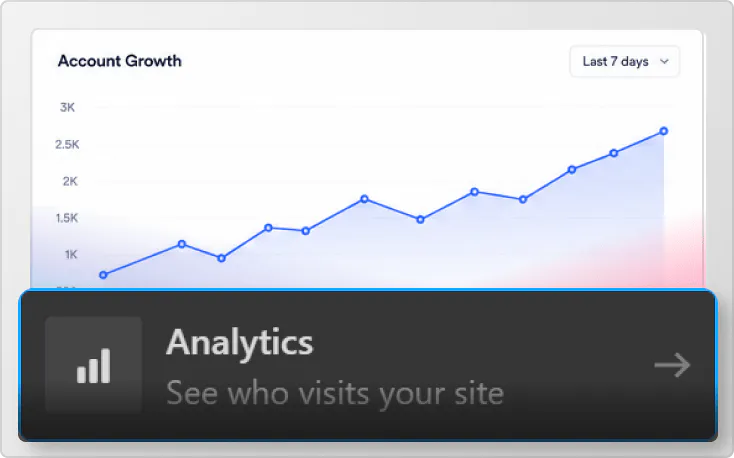
Real-time updates
Update dashboards based on data changes using workflows and structured logic.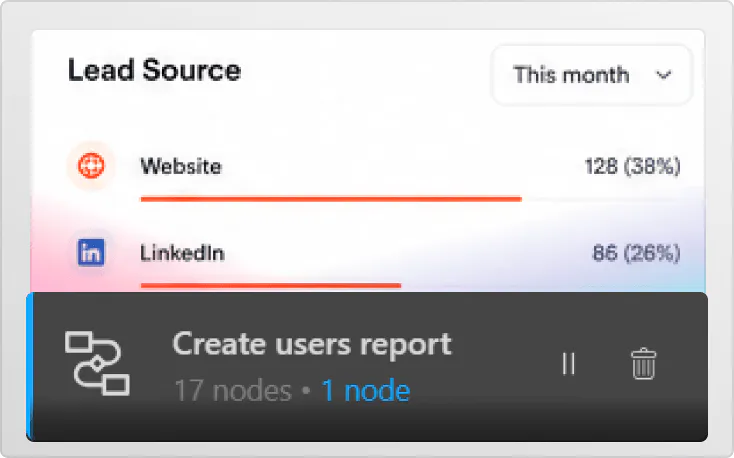
Workflow automation
Automate data processing, calculations, and reporting tasks using workflow-based logic.
Custom metrics tracking
Track business metrics, events, and performance indicators using stored data.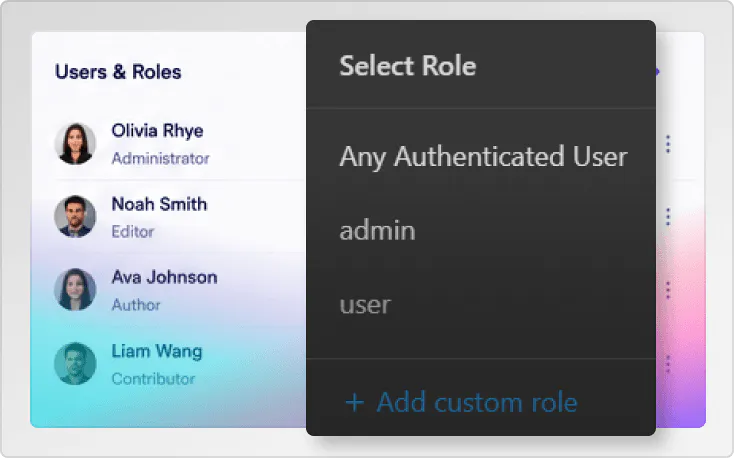
User roles and permissions
Control access to dashboards and reports based on user roles and permissions.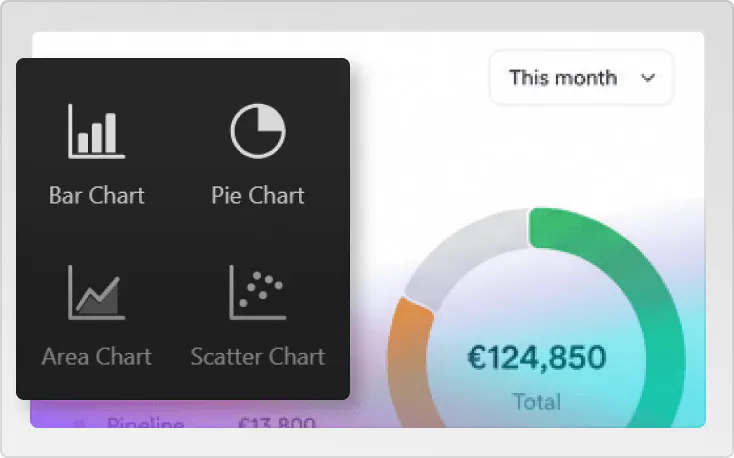
Reporting tools
Generate reports using structured data, calculations, and system activity tracking.Support data-driven decisions
Dashboards for different reporting needs
Dashboard and reporting systems can support analytics, performance tracking, and business insights across industries. With TeleportHQ, you can build systems that match your reporting workflows.Start building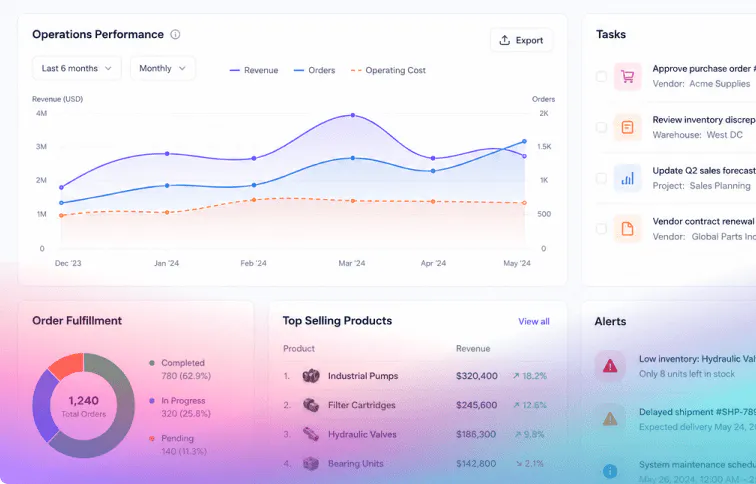
Business analytics dashboards
Build systems where teams can track performance metrics, monitor trends, and analyze data. Use structured data and workflows to manage updates and reporting processes.Business analytics dashboards
Build systems where teams can track performance metrics, monitor trends, and analyze data. Use structured data and workflows to manage updates and reporting processes.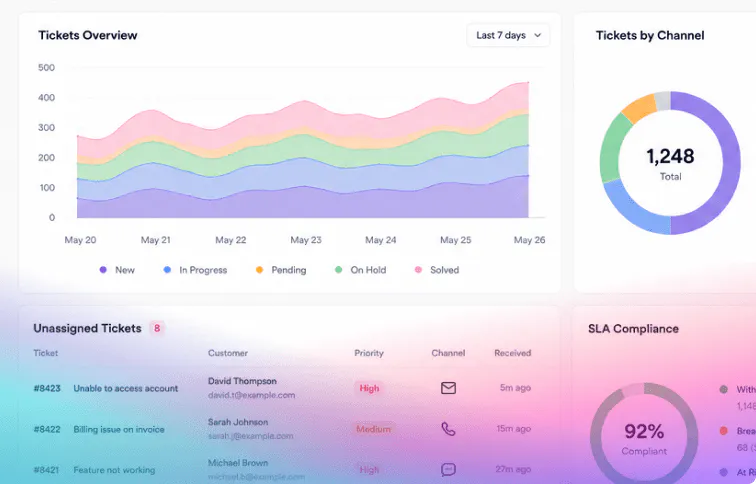
Operational reporting systems
Create platforms where operations data is collected, processed, and visualized for decision-making. Use workflows to automate calculations and maintain accurate reports.Operational reporting systems
Create platforms where operations data is collected, processed, and visualized for decision-making. Use workflows to automate calculations and maintain accurate reports.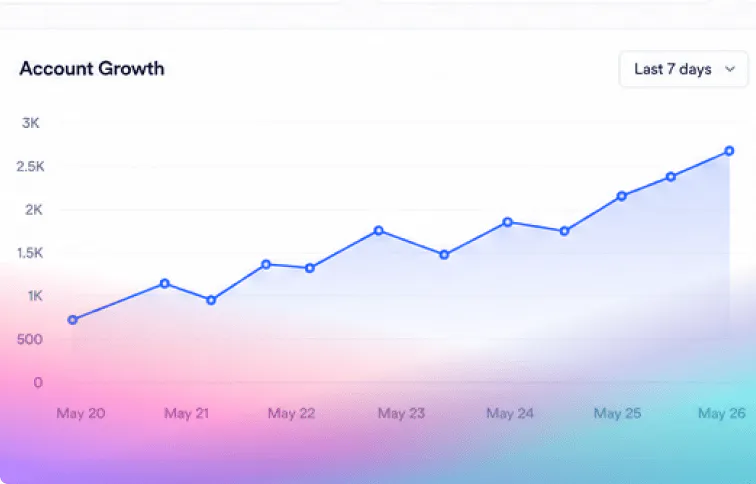
Financial reporting tools
Develop systems where revenue, expenses, and financial metrics are tracked and displayed. Use structured data and workflows to manage reporting and analysis processes.Financial reporting tools
Develop systems where revenue, expenses, and financial metrics are tracked and displayed. Use structured data and workflows to manage reporting and analysis processes.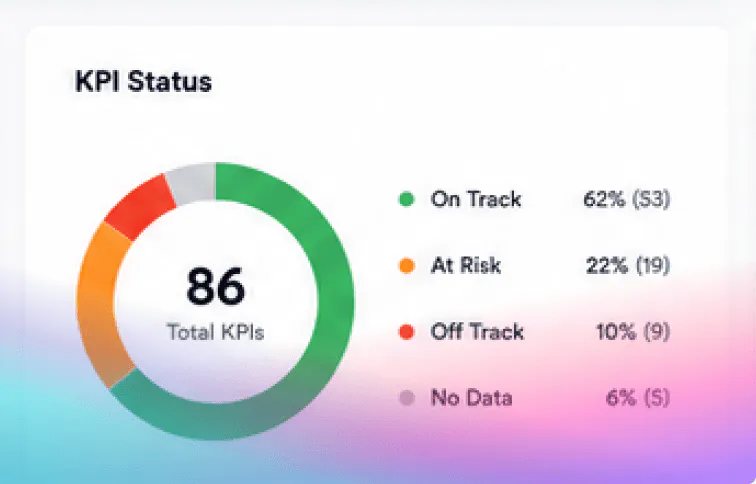
Custom KPI tracking tools
Build tools where key performance indicators are defined, tracked, and visualized. Use workflows to update metrics and ensure consistent reporting across teams.Custom KPI tracking tools
Build tools where key performance indicators are defined, tracked, and visualized. Use workflows to update metrics and ensure consistent reporting across teams.No restrictions on structure
You can customize data structures, workflows, and visual components to match your reporting needs and expand the system over time.
Build your dashboard
Build dashboards around your data
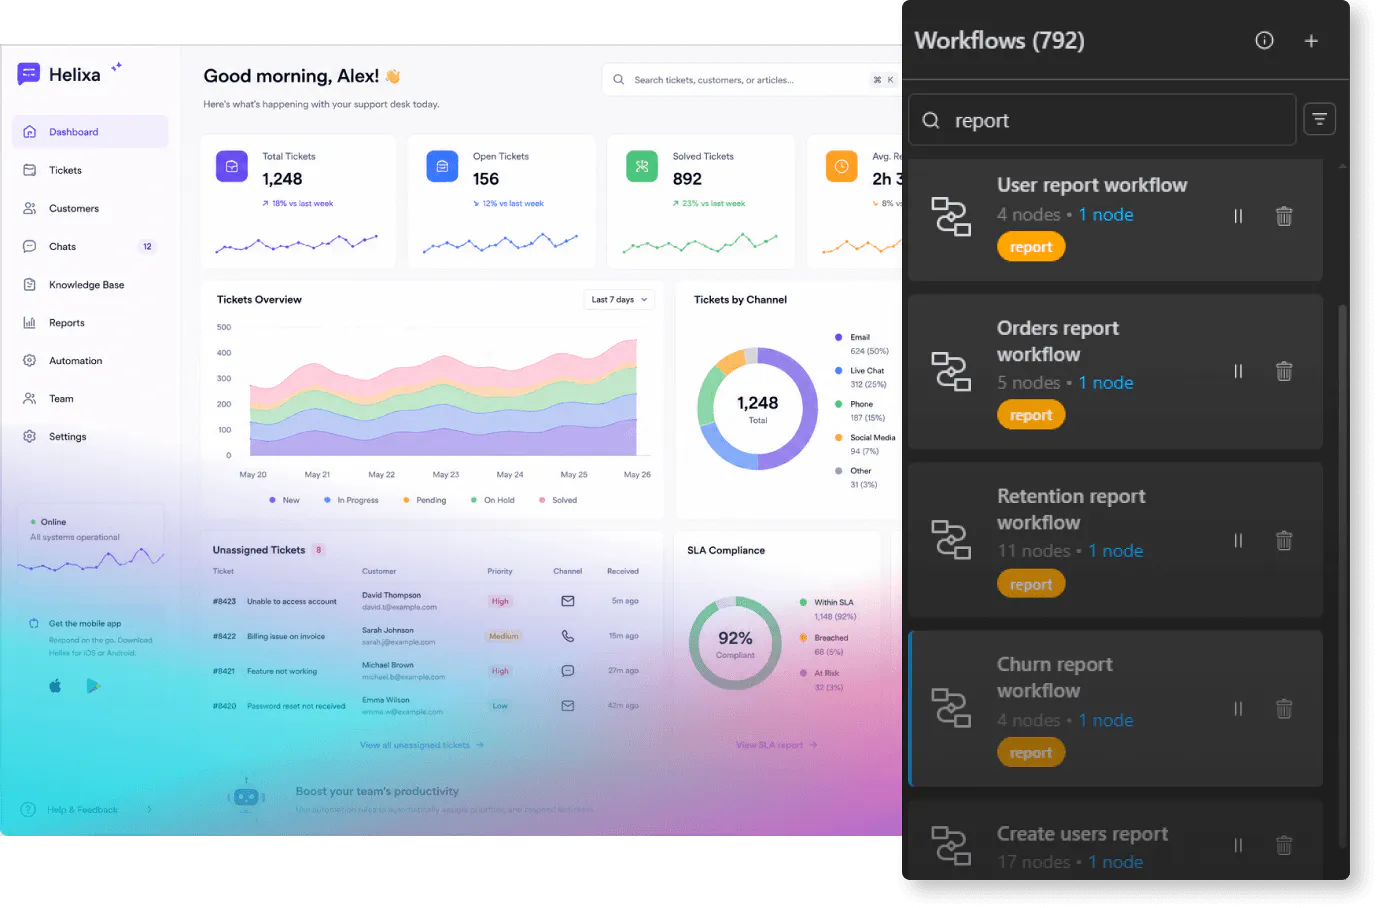
TeleportHQ allows you to define how your dashboards work at every level.You can customize data structures, workflows, and visual components to match your reporting needs and expand the system over time.
Build your dashboard
Extend your reporting capabilities
Combine dashboards with platform features
TeleportHQ connects your dashboards with other features, allowing you to expand functionality and automate data processing. Visual editorDesign dashboards, charts, and reporting views using a flexible visual editing environment.
 AI AssistantGenerate content structures, workflows, and layouts using prompts.
 WorkflowsAutomate data processing, calculations, and reporting using structured workflow logic.
 Admin panelManage data, reports, and system activity through a centralized admin interface.
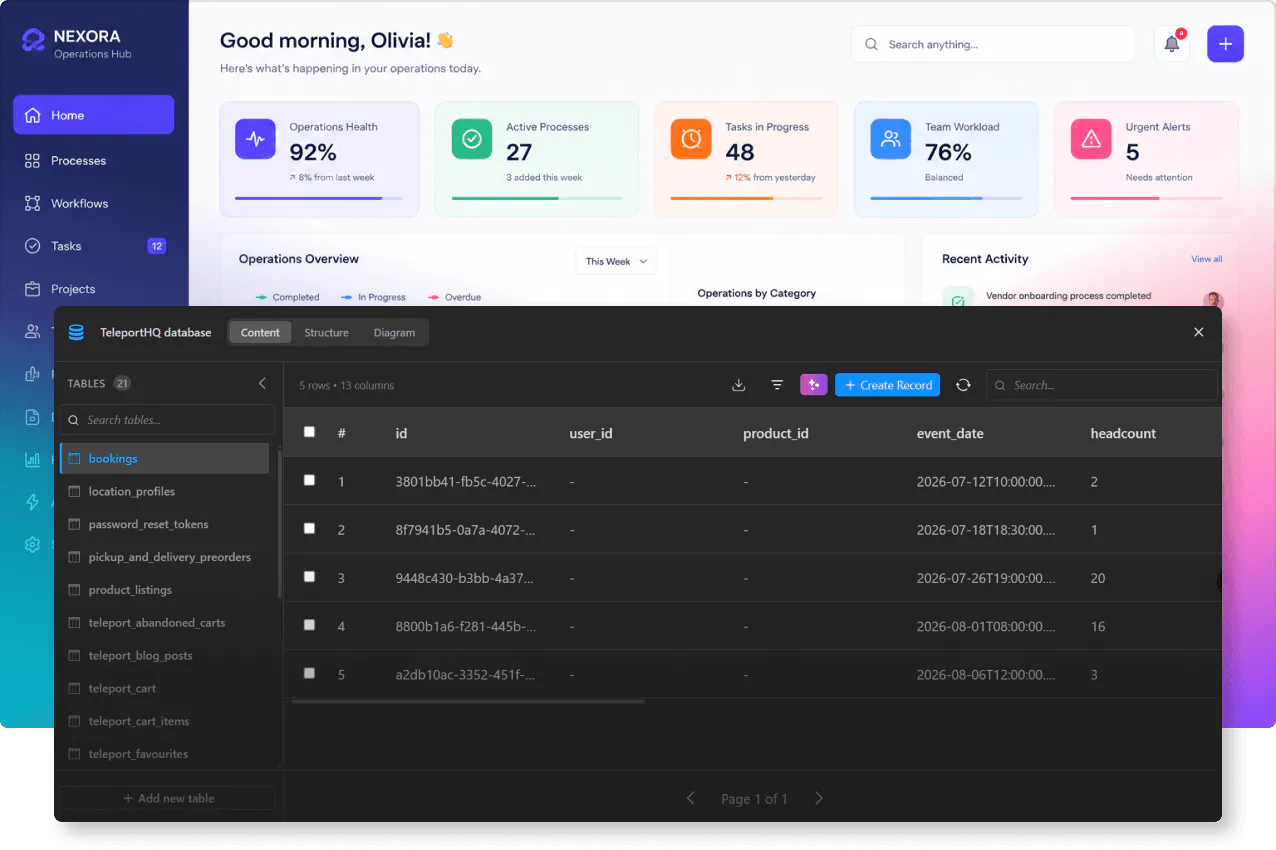
 DatabasesStore metrics, events, and system data using structured and scalable database systems.
 AuthenticationControl access to dashboards and reports using secure user authentication systems.
Control your data systems
A flexible way to build reporting platforms
TeleportHQ allows you to create dashboards that connect directly to your data and workflows. You control how metrics are tracked, how reports are generated, and how users interact with insights.AI-assisted development
Workflow automation
Built-in databases
Full frontend control
Scalable architecture
Custom reporting logic
Faster iteration cycles
Create dashboards that drive better decisions
Build and manage reporting systems with control over data, workflows, and interface. TeleportHQ gives you the tools to create dashboards that scale with your business.Get started for free